We’ve been talking about Web 2.0 for so long now it’s already passé to argue about what it means and what it doesn’t. But one thing’s for sure, there’s a lot of data out there on the web these days. And as web designers, we’re designing a lot of data-driven sites.
There are plenty of options out there for data visualization, too. Google’s recently-announced Charts API is a great example, but there are a number of tools and services for creating charts and graphs as images and for making interactive visualizations with Flash.
There are also great standards-based techniques, such as Eric Meyer’s CSS bar graphs which transform good clean semantic table markup into charts.
All of these options are extremely useful when your data is front and center, when all you’re after is a chart. But what if we want to include data visualization as an integral part of the site, not just an isolated figure or an interactive chart? When we’re designing interfaces for browsing data-driven sites, it’s valuable to be able to create navigation elements that are also visualization tools. We can keep the user informed as they explore, so they can make better decisions about what they’re looking at and what they’re clicking on.
We could build that type of navigation with Flash, or generate static images every time the data changes, but that can be a big tradeoff in terms of accessibility and maintainability.
Even with standards-based markup, there are tradeoffs. If we just want to display the data, we can get the most semantic richness and accessibility hooks with a table. But when what we’re really building is navigation, tables are an awkward and often clumsy tool for the job. What we need is something in between—markup that’s appropriate for navigation, but with some extra hooks for semantics and structure.
I’m going to cover three basic techniques for incorporating some simple data visualization into standards-based navigation patterns. All of them start with the building block of HTML navigation: an unordered list of links. We’re going to tweak the markup a bit and add in some data points and a few hooks for styling, but in each case, the basic pattern is the same familiar one.
Since we don’t have the pure data semantics of a table to rely on, we’ll use semantic class names in the tradition of microformats to preserve as much of the data’s structure in our markup as possible. And since we’re using HTML and CSS, we can use em-based measurements throughout to make sure the charts adapt as the user scales the text size.
Horizontal bar charts#section2
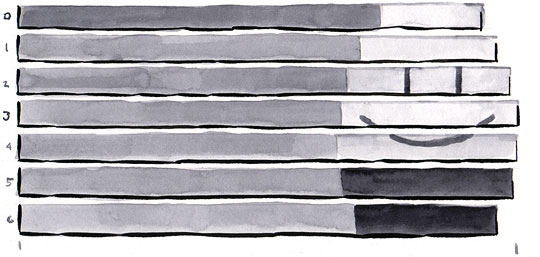
This simple technique just adds bars to a list of items behind the text (check out the finished example for an idea of what we’re shooting for). It works for lists of any length. Longer lists benefit from being sorted by count since the relative values of the bars are easier to read when they are sequential. In this example, we’re going to display the count for each item in the list, but you can leave that out if the value is less important on its own and you’re just showing the relative values for comparison.
Let’s start with a basic unordered list of links. (Line wraps marked » —Ed.)
<ul class="chartlist">
  <li>
    <a href="http://www.example.com/fruits/apples/">Apples</a>
  </li>
  <li>
    <a href="http://www.example.com/fruits/bananas/"> »
    Bananas</a>
  </li>
  <li>
    <a href="http://www.example.com/fruits/cherries/"> »
    Cherries</a>
  </li>
  <li>
    <a href="http://www.example.com/fruits/dates/">Dates</a>
  </li>
</ul>
The first thing to do is add the values for each item in the list. I’ll wrap them in their own span outside the links so we can style them separately. (Line wraps marked » —Ed.)
<ul class="chartlist">
  <li>
    <a href="http://www.example.com/fruits/apples/">Apples</a>
    <span class="count">420</span>
  </li>
  <li>
    <a href="http://www.example.com/fruits/bananas/"> »
    Bananas</a>
    <span class="count">280</span>
  </li>
  <li>
    <a href="http://www.example.com/fruits/cherries/"> »
    Cherries</a>
    <span class="count">200</span>
  </li>
  <li>
    <a href="http://www.example.com/fruits/dates/">Dates</a>
    <span class="count">100</span>
  </li>
</ul>
In order to create the bars, we need to style the list items as block elements so they take up the full width, and set them to use relative positioning so we can position the bars relative to each item. Since the main purpose of this list is navigation, I’ll set display: block on the link elements so the click target fills up the full width of the list as well.
.chartlist li {
  position: relative;
  display: block;
}
I’ll also add in some styles to offset the counts to the right of the list for easy scanning. I’ll use absolute positioning instead of a float so the links and the chart bars can all overlap in the full width of the chart without running into each other.
.chartlist .count {
  display: block;
  position: absolute;
  top: 0;
  right: 0;
  margin: 0 0.3em;
  text-align: right;
  color: #999;
  font-weight: bold;
  font-size: 0.875em;
}
Since we used absolute positioning for the counts, I’ll add some padding to the links to make sure there is room for the numbers to fit next to the link text without overlapping. I’ll also need to add a couple of styles to the links to make sure they always appear above the bars we’re going to position below them. I’ll set their position to relative so they will accept a z-index value, and then set their z-index to something above zero so they’ll stay at the top of the chart.
.chartlist li a {
  display: block;
  padding: 0.4em 4.5em 0.4em 0.5em;
  position: relative;
  z-index: 2;
}
Before I style the bars, I need to add an element to the markup for each item to store the information that the bars will convey. In this case we want to show the relative value of each item in the list compared to the total count for the whole list. So the information we’ll be communicating with the bars will be a percentage calculated from those two values. I’ll add an element to the markup and give it an appropriate class so we can pick it up in the styles. I’ll use a class of index to represent the ratios represented by the chart bars. (Line wraps marked » —Ed.)
<ul class="chartlist">
  <li>
    <a href="http://www.example.com/fruits/apples/">Apples</a>
    <span class="count">420</span>
    <span class="index">(42%)</span>
  </li>
  <li>
    <a href="http://www.example.com/fruits/bananas/"> »
    Bananas</a>
    <span class="count">280</span>
    <span class="index">(28%)</span>
  </li>
  <li>
    <a href="http://www.example.com/fruits/cherries/"> »
    Cherries</a>
    <span class="count">200</span>
    <span class="index">(20%)</span>
  </li>
  <li>
    <a href="http://www.example.com/fruits/dates/">Dates</a>
    <span class="count">100</span>
    <span class="index">(10%)</span>
  </li>
</ul>
A note about the data#section3
In this example chart, we’re showing each item as a percentage of the whole (like a pie chart), but you can use the same technique to show percentages relative to the highest value in the list—so there is always at least one 100% bar and everything else is a percentage of that maximum value. You can also calculate the percentages relative to a baseline value that you set at a fixed percentage (say, 50%), and all the other percentages will be higher or lower based on their deviation from the baseline; performance data for new computer chips and similar products is often displayed in this way.
The math to accomplish this is outside the scope of this article, but the point is that you can use the same markup and style techniques to chart different types of data. Just be sure to use clear titles and descriptions for your charts so the values themselves make sense in context.
In these examples, I’m using made-up data, but there are a variety of ways to calculate the percentages on a real site. You can calculate them on the backend and display them in a template (I’m a big fan of the Django framework’s widthratio template tag, which makes calculating ratios between two variables very easy). You can also use JavaScript to extract the percentage value from the markup and apply it as a width style to the bars. For the purposes of these examples, I’m assuming that all the necessary math is already done, so I’ll use hand-coded inline styles to represent the widths of the bars as percentages. (Line wraps marked » —Ed.)
<ul class="chartlist">
  <li>
    <a href="http://www.example.com/fruits/apples/">Apples</a>
    <span class="count">420</span>
    <span class="index" style="width: 42%">(42%)</span>
  </li>
  <li>
    <a href="http://www.example.com/fruits/bananas/"> »
    Bananas</a>
    <span class="count">280</span>
    <span class="index" style="width: 28%">(28%)</span>
  </li>
  <li>
    <a href="http://www.example.com/fruits/cherries/"> »
    Cherries</a>
    <span class="count">200</span>
    <span class="index" style="width: 20%">(20%)</span>
  </li>
  <li>
    <a href="http://www.example.com/fruits/dates/">Dates</a>
    <span class="count">100</span>
    <span class="index" style="width: 10%">(10%)</span>
  </li>
</ul>
Finishing up the bar chart#section4
The final step for this chart is to add the styling for the bars. I’m going to hide the actual percentage (using the text-indent trick from Mike Rundle’s trusty image replacement technique) since the precise value isn’t as important as the relative scale and the bar will do nicely on its own. If you need to show the percentage, you can choose to display the percentage within the bar or use separate elements for the bar and the percentage.
I’ll set the height of the bars to 100%, and since we’ll be setting the actual width later, I’ll set a default width of 0 so the bars won’t show up at all if we don’t give them an explicit value. I’ve chosen a light blue for the bar backgrounds, so the link text will be readable when it overlaps the bar, but the bars will still be easily visible.
.chartlist .index {
  display: block;
  position: absolute;
  top: 0;
  left: 0;
  height: 100%;
  background: #B8E4F5;
  text-indent: -9999px;
  overflow: hidden;
}
I’ll add in some hover styles for the chart rows and some borders and padding for readability, and we’ve got ourselve a chart (see the finished example). One thing to note is how it looks with styles turned off. Because we made sure to put the percentages in the markup, the information we’re conveying with a fancy chart is still accessible when that presentation degrades.
Timeline charts#section5
Once you’ve established the basic recipe of good old semantic navigation with a sprinkling of data and some CSS to turn the data into a chart, there are lots of variations you can apply to different types of data. One easy trick is to turn the chart on its side to make a timeline (see the second chart in the finished example).
I’ll start out with markup that’s very similar to the first chart. In this case, it’s a list of days, with a value for each day. Since I have limited space in the horizontal format to show labels for each bar, I’m just going to show the day of the month in the label and use a header above the list to indicate the month. Since this is meant to be navigation, and the chart will convey the relative values (which is what we’re after), it’s okay that we’re not showing all the information here. As an extra convenience, I’ll add a title to the links with the full date and the count for that day, so that detail will show up in a tooltip for each bar. (Line wraps marked » —Ed.)
<ul class="timeline">
  <li>
    <a href="http://www.example.com/2007/dec/1/" »
    title="December 1, 2007: 40">
      <span class="label">1</span>
      <span class="count">(40)</span>
    </a>
  </li>
  <li>
    <a href="http://www.example.com/2007/dec/2/" »
    title="December 2, 2007: 100">
      <span class="label">2</span>
      <span class="count">(100)</span>
    </a>
  </li>
</ul>
Repeat as necessary. In this example, I’ve created a 30-day chart with a bar for each day, but you could make the chart any length and size you need. If you’re making a chart with fewer bars, you can make them larger and make room for longer labels underneath.
In order to make sure the labels fit in the space underneath the bars, I’m going to size the entire chart using ems so it will flex up and down with the text size. To make things simpler, I’ll go ahead and set the text size I want to use for the labels on the main .timeline element, so I can size everything relative to that. I’ll set the height of the whole chart to 10 ems, which leaves 8 ems for the bars and 2 ems for the labels with a little padding.
.timeline {
  font-size: 0.75em;
  height: 10em;
}
.timeline li {
  height: 8em;
}
As before, I’ll set the list items to use relative positioning, since I’ll be using absolute positioning to pin the bars to the bottom of each one. (If I didn’t use absolute positioning relative to each list item, the bars would just dangle from the top, which isn’t quite the look we’re going for.) I’ll float the list items to the left so the bars will line up next to each other horizontally. I’ll set the width of each bar to 1.5 em and the height to 8 em to give us enough room for the two-digit labels below, and put just a little padding on either side to separate the bars from each other. I’m using ems for all these dimensions so the bars and the labels will scale up together when the text size changes.
.timeline li {
  height: 8em;
  position: relative;
  float: left;
  width: 1.5em;
  margin: 0 0.1em;
}
Since I want the entire area of the bar and label to be clickable, I’ll set the links to display: block and height: 100% so they fill the available space we’ve created for the list items.
.timeline li a {
   display: block;
   height: 100%;
}
I want the labels to display below the bars, but since I want both the bars and the labels to be clickable, I’ve placed them both inside the a tag. In order to move the labels out of the way, I’ll use absolute positioning with a negative bottom value. Since the bars have a height of 8 em and the chart is 10 em I’ll move the labels down from the bottom of the bars by -2 em. I’ll give them a line-height of 2 em as well, so no matter what the text size, they’ll have plenty of room right in the middle of that vertical space. We’ll pin them to the left side of the bars and set them to take up the full width with the text aligned in the center.
.timeline li .label {
  display: block;
  position: absolute;
  bottom: -2em;
  line-height: 2em;
  left: 0;
  width: 100%;
  text-align: center;
}
Since we’re not going to be displaying the counts in this chart, I’ll just use the count element to display the bar, using the same combination of text-indent and overflow to hide the text. I’ll give the bars a solid background and position them from the bottom left of the list item. Reversing what we did for the horizontal bar chart, I’ll set the width of the bars to 100% and the height to zero.
.timeline li a .count {
  display: block;
  position: absolute;
  bottom: 0;
  left: 0;
  text-indent: -9999px;
  overflow: hidden;
  width: 100%;
  height: 0;
  background: #AAA;
}
For this chart, I don’t want the each bar to represent a percentage of the total for the whole chart, since there are so many items and the bars would all be tiny. Instead, I want the day with the highest count to be the tallest bar, so I’ll set the height on that to 100% and calculate the heights of all the percentages of that highest day’s count. You can see results (with fake data but real math) in the finished example. I’ve also added a hover style to highlight the bar, label, and background area so it’s clear which item is about to be clicked on.
Sparklines#section6
Now that we’ve tipped our chart on its side to make a timeline, we can shrink it down to make a sparkline—a handy way to show a snippet of data inline with text (see the finished example). You can see from the example that we’ll basically just be shrinking the timeline chart. With bars instead of lines, it won’t be a true sparkline, but it fits the spirit of packing a lot of information in a simple, word-sized chart.
The starting markup is a little different this time. Since we’re creating multiple charts, we’ll still start with an unordered list, but each list item will contain a full chart. Since sparklines are meant as an unobtrusive way to display information inline with text, we can try to reflect that even in the unstyled markup by using inline elements for each of the data points. What we’re shooting for is something that reads reasonably clearly even without the CSS applied. Take a look at this example with the styles removed to get a better idea.
I’ll start with a span as the container for the chart, and use another span with a class of index as the container for each bar. Each number in the series is wrapped in its own span with the count class. This is what we’ll use to style the bar. Since I’ll be hiding all the text within the inner span.count tag anyway, I’ve gone ahead and added commas between each one and parentheses around the whole set to make the unstyled content a little clearer.
<span class="sparkline">
  <span class="index"><span class="count">(60, </span></span>
  <span class="index"><span class="count">220, </span></span>
  <span class="index"><span class="count">140, </span></span>
  <span class="index"><span class="count">80, </span></span>
  <span class="index"><span class="count">110, </span></span>
  <span class="index"><span class="count">90, </span></span>
  <span class="index"><span class="count">180, </span></span>
  <span class="index"><span class="count">140, </span></span>
  <span class="index"><span class="count">120, </span></span>
  <span class="index"><span class="count">160, </span></span>
  <span class="index"><span class="count">175, </span></span>
  <span class="index"><span class="count">225, </span></span>
  <span class="index"><span class="count">175, </span></span>
  <span class="index"><span class="count">125)</span></span>
</span>
I’ll float the whole chart to the left to set it next to the text. Using a float here is a bit of a cheat, since sparklines are supposed to be able to appear directly inline with text. But until we get more consistent support for the inline-block display property (which is the effect we really want), a simple float will have to do. Since we want the chart to be the same size as the text, I’ll give it a height of 1em, and a little margin on either side to give it some breathing room.
.sparkline {
  float: left;
  height: 1em;
  margin: 0 0.5em;
}
Since the .index elements are the bar containers this time around, we’ll set position: relative on them, and float them to the left. I’ll make the bars 2px in width, since 1px is a little too small to really register. We want them to take up the full height of the chart, just like in the timeline, so we’ll set the height to 100%.
.sparkline .index {
    position: relative;
  float: left;
  width: 2px;
  height: 1em;
}
For the bars themselves, we’ll follow almost exactly the same pattern as we did for the timeline, and apply the text-hiding trick.
.sparkline .index .count {
  display: block;
  position: absolute;
  bottom: 0;
  left: 0;
  width: 100%;
  height: 0;
  background: #AAA;
  overflow: hidden;
  text-indent: -9999px;
}
I’ll also add some basic styles and padding to the unordered list containing our sparkline set. You can see the results in the finished sparklines example.
Don’t underestimate the Force#section7
You can see all the charts together in the final example. Try adjusting the text size and see how the charts adapt with the rest of the page, or check out the unstyled example to see how the markup degrades for machine readers or environments without full CSS support.
Obviously, these charts are simple, and these techniques aren’t the best option in every situation. When you need semantically rich markup—when you have a large set of data or a lot of categories to compare, nothing beats a table. For fancy visualizations like scatterplots and 3D pie charts, you might choose some kind of server-side tool to generate images. For extra interactivity and animation, Flash is probably the way to go.
It’s certainly not a universal framework for data display, but it does add a lot of context to what would otherwise be blind navigation. And you can start to see how these techniques could be the building blocks for more complex implementations.
So, when you want to build some ambient visualizations that are integrated with the structure of a data-driven site, remember: you can go a long way with accessible, standards-based markup and some simple CSS.
I’d like to see how you’d solve a pie-chart 😉
Question: why not ordered list for the charts sorted by value? And have you considered using definition lists? I think a definition list would show the relation between data and value, where your spans have no semantics.
Unless the values are in a specific order (like chronological or ranking), the unordered list is accurate. When I’m explaining that to someone I always ask them “If I scramble the order of these list items, does it make a difference?”.
I made a PHP based graph (styling a UL) similar to this a little while ago: http://www.csskarma.com/lab called “dynamic CSS graph and table”.
I like this technique; It takes a lot of the multidimensional table attributes like ‘axis’ and matching ‘headers’ to ID’s out of the equation, and should leave you with some cleaner code to deal with.
my2cents
I’m not sure why I made my name the subject of that post… sorry about that
At the risk of sounding whiny, I think it would have been nice to mention using canvas and SVG as alternative methods for data visualization (instead of just Flash).
Several libraries already exist for this purpose, and although they may not all provide full cross-browser support, I would personally prefer to use them over Flash.
This reminds me a bit of HTML5’s “˜meter’ element: http://www.whatwg.org/specs/web-apps/current-work/#the-meter
I dont like the markup, though: every “˜span’ is one “˜span’ too much. If only “˜display: block’ for the table elements worked reliably across browsers.
http://www.alistapart.com/d/accessibledata/example-barchart.html
is tabular data.
Sarven Capadisli said:
bq. example-barchart.html is tabular data.
Saren, good point, but from paragraph 6 of the article:
bq. If we just want to display the data, we can get the most semantic richness and accessibility hooks with a table. But when what we’re really building is navigation, tables are an awkward and often clumsy tool for the job. What we need is something in between—markup that’s appropriate for navigation, but with some extra hooks for semantics and structure.
I built a javascript pie chart some years ago. Nice to see it is still being used:
http://qsuper.qld.gov.au/public/members/member_services/calculators/tools/investment_choice.asp
It degrades nicely as it simply disappears. 🙂
@Jeffrey Zeldman:
I disagree. First of all, the nature of that content as a whole is best fit for tabular data. Whether one wishes to navigate through that information or not is independent.
The main problem that I see here is dumping the content in chunks; building a navigation first and then adding new markup to fit into the existing markup.
This approach is wrong in my opinion because the content need not be placed in pieces.
Look at the full content you want to place in a document and then find the most suitable HTML elements to encapsulate that data.
“Obviously, these charts are simple, and these techniques aren’t the best option in every situation. When you need semantically rich markup—when you have a large set of data or a lot of categories to compare, nothing beats a table. For fancy visualizations like scatterplots and 3D pie charts, you might choose some kind of server-side tool to generate images. For extra interactivity and animation, Flash is probably the way to go.”
i enjoyed this entry. finally a ALA article without philosophical fluffs in a while.
while i understand your article is to demonstrate the usage of css to create accessible basic charts, but i question the practicality of it. i almost feel like you’re doing it simply for the purpose of demostration. as you said above, for more complex charts (piecharts, interaction, etc) it may require an official charting method, may it be server side or client side.
in my experience building web apps, or public sites, complex charts, or interaction is always required. so it’s hard to do charts in pure css alone. and building a set of code for css only, and another for more complex charts is just not efficient. so i most likely will end up doing charts the non css way, at least for now.
bq. …the nature of that content as a whole is best fit for tabular data. Whether one wishes to navigate through that information or not is independent.
I’m curious: how would you mark up and style a table of data where the bars and such need to be interactive, as in clickable links?
Jin Y said…
bq. while i understand your article is to demonstrate the usage of css to create accessible basic charts, but i question the practicality of it. i almost feel like you’re doing it simply for the purpose of demostration.
I should have mentioned this in the article itself, but all the techniques I described are in use on EveryBlock, the local news project I’m currently working on. You can see an example the timeline and bar charts in action on this “overview of crimes in Chicago”:http://chicago.everyblock.com/crime/ and the sparklines on this “breakdown of crimes by neighborhood”:http://chicago.everyblock.com/crime/locations/neighborhoods/.
Wilson, the charts look very nice on EveryBlock. However, to further my point from before, what would your approach be if a piechart/scatterchart is to be added to the site?
If from the project planning phase, it’s determined that the the only type of chart the site will ever shown is bar charts that can be done with the css techniques you presented, then that’s fine. (it could very well be the case with the project you are working on). however, for the sake of scalability and consistency, i use a designated charting software instead of css. i’m not dismissing the benefit of css charting, however i feel it’s not efficient to have one set of css charting code, while using a 3rd party software to deal with the others. just my two cents.
@Eric Meyer:
http://www.csarven.ca/labs/html/horizontal_bar_chart.html
Notes:
* Tested only in Firefox
* The visual/interaction is not a 1-1 replicate of the example that is used in this article but I think it is fairly close.
* The whole row is not an anchor
* I’m certain that the CSS can be cleaned up further and possibly have it even more closer to the example (I can’t invest more time into this at this time)
🙂
Loved the example, as a newcomer to standards and when and why you should use them this is a great idea. thanks for writing the article I can’t wait to try it out.
Who prints anymore? Well actually a lot of people still like to print charts out on real paper. These charts don’t print nicely at all…any ideas on how you would handle that?
Those ideas are absolute genius! This kind of article is exactly why I read ALA – real, practical ideas that I can put into practice 🙂
The first two charts – the bar chart and the timeline – are a fantastic idea. Using the markup of a table but representing it as a chart by CSS is much better than referencing an image and having to provide alt text or longdesc. My only concern is whether browsers or assistive technologies with inferior CSS capabilites will be able to make sense of it. I hope so!
I’m not so sure about the final example. This seems to be an incredibly complicated way to create a very basic chart. In this case, I think I would just create the charts as images.
Robin Hood said…
bq. These charts don’t print nicely at all”¦any ideas on how you would handle that?
The example styles are scoped to media=”screen” since I decided it was out of the scope of the article to get into print styles. If you just change the media attribute on these styles to “all” they actually print pretty well, as long as the user has background printing turned on in their browser. Since you can’t rely on that, I’d recommend setting a border on the bars in a separate print style to make sure the bar shows up.
Everyone seems to be favoring Draconian semantics and edge cases rather than practical solutions in appropriate situations. Nobody said this approach was going to scale for all cases, but it works well in a lot of them.
I love it. It’s the first design article on ALA that designers can use immediately and with visually pleasing results. Keep up the good work, Wilson.
I just noticed that the “Google Chart API”:http://code.google.com/apis/chart/#sparkline allows you to insert “Sparklines”:http://en.wikipedia.org/wiki/Sparklines easily… Yea Google!
“Flot”:http://code.google.com/p/flot/ – a “jQuery”:http://jquery.com plugin is a fantastically simple and beautiful option for rendering line graphs. The “examples”:http://people.iola.dk/olau/flot/examples provided give a good idea of how rich and powerful it can be too.
Nicely done, but unfortunately it doesn’t meet the requirements set forth in the article– namely, having the whole “row” (or “data atom” or whatever) be clickable. You got close, but without either a good deal of JavaScript or a full working implementation of XHTML 2, I don’t think it’s possible to do with valid table markup.
It’s a shame we’re still having to make these kinds of compromises, but there it is.
This is nicely done. There are some other examples on the web of accessible diagrams and visual aids:
Eric Meyer’s Bar Graph: http://meyerweb.com/eric/css/edge/bargraph/demo-table.html
@ Blaise Kal
And my Venn Diagram (which could be used for a pie chart as well) that I posted back in Sept. of 2007:
http://www.heyokadesign.com/news.asp?post=more-accessible-venn-diagram
Something to think about, however, is that in certain situations the use of the ‘dreaded table’ can have more meaning.
Despite the issue of whether data belongs in a table or not I think this is a great example especially for developers. I deal with very large data sets and markup of this nature gives clients exactly what they want rather than a giant table to endlessly scroll through.
that was gr8 info ,thanks
I wonder if they can get that programed into my new self-destructing IM service from Bigstring. Then all my needs will be met.
If we just want to display the data, we can get the most semantic richness and accessibility hooks with a table. But when what we’re really building is navigation, tables are an awkward and often clumsy tool for the job. What we need is something in between—markup that’s appropriate for navigation, but with some extra hooks for semantics and structure. My new venture http://www.shadoz.com/css-template-07.htm
Beautifully displayed.
Nice idea and so simple to implement in php.
you can see it in PHP here:
http://www.chausstran.com/immobilien/stats.php?id=2
please see
http://www.jjlg.com/weblog/
It’s updated daily with web log- statistics about visits to my eponymous site. The use of the term “log” is a pun, because the scale is log-arithmic, and it is about a “log”.
Barcharts and sparklines are selected from a two-dimensional index grid, by time and by rank of number of hits, to what page or image – and from what IP address. What comes out is a classic Wiebel distribution with a long tail. Hover over any barchart and get a tooltip with all the juicy data. I find it all very interesting – and enjoyable.
Thanks for the excellent writing, great article, and it really helped. I just decided to make all links hover differently and changing one line of CSS, the entire site behaves better, including the barcharts and sparklines in the weblog page.
Keep up the good work, let’s have more – a whole-enchilada CSS-driven minimalist data-graphing tool. Or did you already and I missed it?
Have you seen http://interface.fh-potsdam.de/infodesignpatterns/patterns.php ?