As companies like Google and Yahoo! have simplified the process of placing information on a map by offering web services/APIs, the popularity and abundance of mapping applications on the web has increased dramatically. While these maps have had a positive effect on most users, what does it mean for people with accessibility needs?
Most online mapping applications do not address issues of web accessibility. For a visually impaired web user, these highly visual maps are essentially useless.
Is there a way to display text-based data on a map, keeping it accessible, useful and visually attractive? Yes: using an accessible CSS-based map in which the underlying map data is separated from the visual layout.
A different starting point#section2
So what if, instead of starting from a map graphic and adding data to points located across the image, we start with the data itself and create a map based on the data?
First, let’s pick some data that has a geographic component so it can be placed on a map. For example, let’s use the 10 most populated cities in the world. Displayed as plain text, the list might look like this:
- Tokyo, Japan – 28,025,000 people
- Mexico City, Mexico – 18,131,000 people
- Mumbai, India – 18,042,000 people
- Sao Paulo, Brazil – 17,110,000 people
- New York City, USA – 16,626,000 people
- Shanghai, China – 14,173,000 people
- Lagos, Nigeria – 13,488,000 people
- Los Angeles, USA – 13,129,000 people
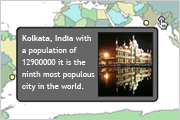
- Calcutta, India – 12,900,000 people
- Buenos Aires, Argentina – 12,431,000 people
Note: The data above is intended only as an example and may not be entirely accurate.
Not bad, but it would be nice to add some descriptive text to each of the cities to describe a little more about them. So, an example for just one city might be:
- Shanghai, China
- Shanghai, China is situated on the banks of the Yangtze River and has a population of 14,173,000, making it the sixth most populated city.
Organizing the data#section3
Now that we’ve added some descriptive information to the city, let’s think about how to organize that data in HTML. A definition list (dl) would be a good way to organize this information because a dl has both definition term (dt) and definition description (dd) child elements. This means we can have the city’s name as a dt and the city description as a dd. Let’s see how that might look:
<dl>
<dt><a href="http://en.wikipedia.org/wiki/Shanghai%2C_China"
class="location" id="shanghai">Shanghai, China</a></dt>
<dd>Shanghai, China is situated on the banks of the Yangtze
River and has a population of 14,173,000, making it the
sixth most populated city.</dd>
...
Bringing the rest of our data into the definition list gives us the complete list of 10 cities.
Note that the anchor link within the dt was given a class and unique id. The id allows us to refer to each city individually, so we can locate it on the map. We’ll come back to this a little later.
Adding some style#section4

So where are we now? We’ve created an accessible text-based list of items and their definitions. The data is what we want to convey to the user, regardless of whether they see it on a map or just as text, so we are in good shape. Now that we have the information organized, let’s make a point map out of it.
In a point map, there are three main items that are visually displayed: the map, the point(s) on the map, and data to display when the user clicks on or hovers over a point. We can very easily translate those visual items to the text-based dl we just created:
- Map image =
dl - Map point(s) =
dt > a - Map point popup data =
dd
The first step in making dl into a map is to add the background map image with a style. We will give the dl a class of “map” so that only those dls in a document get styled this way (in our example, as a world map).
dl.map {
background: url(worldmap.png) no-repeat;
border: 1px solid #999;
margin: 0px;
padding: 0px;
text-align:left;
width: 550px;
height: 275px;
position: relative;
}
The next step is to add a style for the dts that will allow the anchors within to be made into points on the map:
dl.map dt {
display: inline;
}
Next, we need to deal with the dd items which will be the data displayed when a point on the map is hovered over. We do not want the dd to display until the a within its associated dt is hovered, so by default we need to hide the dds. Since screen readers will ignore an HTML element with a style of display: none, we need to hide the data by positioning it far away from the browser’s view. The style for the dd will make the element look like a tooltip window:
dl.map dd {
background: #555;
border: 2px solid #222;
border-radius: 8px; /* CSS3 rounded corners */
-moz-border-radius: 8px; /* Mozilla rounded corners */
color: #fff;
padding: 4px;
width: 200px;
position: absolute;
left: -9999px;
z-index: 11;
}
Each of the dts contains an a which, by default, takes a user to the Wikipedia article corresponding to the city; this link is what will trigger the tooltip to display the dd. The link will be displayed as a point and the link text will be invisible, so again we need to move the text out of the browser’s view. Each point will also have a different location, but we’ll take care of that in the next step. The base style for the anchor links looks like this:
dl.map a.location {
background: url(point.png) no-repeat;
display: block;
outline: none;
text-decoration: none;
text-indent: -9999px;
width: 10px;
height: 10px;
position: absolute;
z-index: 10;
}
dl.map a.location:hover {
background: url(point-hover.png) no-repeat -1px -1px;
}
Finally, we need to add styles specific to each point on the map. These points are represented by the anchor links inside each of the dts. The placement of each point will be accomplished by assigning top and left values (since we already positioned them all absolutely in the above code snippet):
dl.map a#shanghai {
top: 80px;
left: 484px;
}
dl.map a#tokyo {
top: 105px;
left: 121px;
}
...
We’ve just created a basic map, so let’s look at where we are with our first example. This example places the points on the map, but does not display any information when a point is hovered over.
Display the data as a tooltip#section5
Now that we have a map with points positioned, we need to display data when the points are hovered over. To display a tooltip we are going to have to use some JavaScript.
The JavaScript to show and hide the dd “tooltip” does so by modifying the style of the dd associated with the current a being hovered. A JavaScript function named showTooltip() places the dd back into the visible area of the browser by modifying its top and left style values, based on the location of the associated a point.
It would be very easy for us to use inline event handlers like onmouseover and onmouseout to accomplish this, but that wouldn’t be very unobtrusive. We want like our script to remain independent of our map and our markup. To do that we can have the JavaScript dynamically assign events to the anchor elements.
But before we dig into the JavaScript, let’s pause for a moment to talk about JavaScript objects. The JavaScript used in this technique makes use of object literal notation, so learning the basics of this will help you understand how it all works. Here is a basic example of an object literal:
var person = {
name: "Homer Simpson",
say: "Doh!",
talk: function(){
alert( this.say );
},
walk: function(){
// code
}
};
One of the benefits of using objects in JavaScript is that we can use methods and properties in a more sensible manner. For example, with the above code we can call a method like person.talk() or get a property like person.name. Objects also allow us to reuse method and property names without causing conflict. For instance, if we were to add an animal object to the file above, it could also have an walk method (animal.walk()) without conflicting with the person.walk() method.
The script used to assign the events in this technique is a little more complicated, but here is a shortened skeleton of what this example script looks like:
var mapMaker = {
offsetX:     -16,  // tooltip X offset
offsetY:     16,  // tooltip Y offset
init:        function(){
// sets up the maps
},
showTooltip: function(){
// shows the tooltip
},
hideTooltip: function(){
// hides the tooltip
},
addEvt: function( element, type, handler ){
// adds the events
}
};
Now let’s dig a bit deeper into some of the methods. For the sake of brevity we will not cover every method, but we will tackle the key ones.
The init() method is our constructor. This means the method is what we call to initialize our mapMaker object. It sets up the map by adding events to each of the anchor links inside the dts, making the tooltips possible. Let’s look at the init method:
init: function(){
var i  = 0;
var ii = 0;
var location;
var DLs = document.getElementsByTagName('dl');
while( DLs.length > i ){
if( DLs[i].className == 'map' ){
mapMaker.stripWhitespace( DLs[i] );
var DTs = DLs[i].getElementsByTagName( 'dt' );
while( DTs.length > ii ){
location = DTs[ii].firstChild;
mapMaker.addEvt( location, 'mouseover',
     mapMaker.showTooltip );
mapMaker.addEvt( location, 'mouseout',
     mapMaker.hideTooltip );
mapMaker.addEvt( location, 'focus',
     mapMaker.showTooltip );
mapMaker.addEvt( location, 'blur',
     mapMaker.hideTooltip );
ii++;
};
ii = 0;
}
i++;
};
},
The init method first collects all of the dl elements in the document by using document.getElementsByTagName( 'dl' ) and then loops through each, looking for one with a class of “map”. When it finds one, it collects its dt elements and loops through them, assigning event handlers (using the addEvt() method) to the anchor tag within. The events we’ve accounted for include mouseover (which calls the showTooltip() method) and mouseout (which calls the hideTooltip() method) and mirrors the same actions for the focus and blur events, respectively, to make the tooltip available for keyboard users.
Now let’s take a closer look at a portion of the showTooltip() method; this method displays the tooltip dd when a map point (dl.map > dt > a) is hovered. To display the correct tooltip, the function must know which dd is associated with each anchor. From the currently hovered anchor tag, this, we can move to its parent dt tag (this.parentNode) then to that dt’s dd (this.parentNode.nextSibling) which is the tooltip we want to display:
showTooltip: function(){
var a = this;
var tooltip = a.parentNode.nextSibling;
...
Once we know which dd element should be displayed we can set the different style attributes to place the dd tooltip into view and move it into the correct location next to the point:
  ...
// get width and height of background map
var mapWidth  = tooltip.parentNode.offsetWidth;
var mapHeight = tooltip.parentNode.offsetHeight;

// get width and height of the tooltip
var tooltipWidth = tooltip.offsetWidth;
var tooltipHeight = tooltip.offsetHeight;

// figure out where to place the tooltip based on the point
var newX = a.offsetLeft + mapMaker.offsetX;
var newY = a.offsetTop + mapMaker.offsetY;

// check if tooltip fits map width & adjust if necessary
if( ( newX + tooltipWidth ) > mapWidth ){
tooltip.style.left = newX - tooltipWidth - 24 + 'px';
} else {
tooltip.style.left = newX + 'px';
}

//check if tooltip fits map height
if( ( newY + tooltipHeight ) > mapHeight ){
tooltip.style.top = newY - tooltipHeight - 14 + 'px';
} else {
tooltip.style.top = newY + 'px';
}
...
In the script above the dd tooltip style is changed to bring the element back into the visible area of the map, but the script also takes into account the size of the map and positions the tooltip so it does not go outside the background map image boundaries.
The last detail we need to worry about is running the script when the webpage has loaded. Sounds easy just call window.onload = mapMaker.init() right? Well you could do that, but it doesn’t allow other scripts to run on page load and it would be really nice to trigger this script to run after the page has loaded but before all of the images have downloaded. Thankfully, Dean Edwards has done the work for us on this one and you can check out his write-up of the technique for more information.
We have now reviewed the major parts of this map example’s JavaScript, but did not cover every single function in the script. The functions for adding events get fairly complicated and are outside the scope of this article; however, you can view the entire script here.
Now that we have added some JavaScript functionality let’s look at where we are with this second map example. We now have a visually pleasing map that provides more detail when the user hovers over a city. Of course, because this map is created from text-based data, the data displayed as a map can be read by a screen reader and convey the same meaning.
What about CSS on and JavaScript off?#section6
We need to address users who have JavaScript turned off but use a browser with good CSS support. We want these users to get the lo-fi, but useable text version of the map, because without JavaScript enabled they won’t be able to see the tooltips.
To enable the tooltips and the map style, the JavaScript init() method can be tweaked to turn the map “on.” If the map is not “on,” it will simply display as text only. As we have given our map dl a class of “map,” we’ll need to add a second class: “on.” We’ll also need ot update our style sheet, adding .on to each style rule like this:
dl.map.on {
background: url(worldmap.png) no-repeat;
border: 1px solid #999;
margin: 0px;
padding: 0px;
text-align:left;
width: 550px;
height: 275px;
position: relative;
}
The above style will only affect dls that have are class-ified as both “map” and “on” (<dl class="map on">) and will not affect any dls with only a class of “map.” You can see this in action in our third example.
Getting fancy#section7

Now that we have a functional map, why don’t we add some images to the tooltip? This next example map shows images inside the tooltip. Or, maybe you would like to have links inside the tooltip. To do this, we need the tooltip to be “sticky” and not hide when the point is moused off. Here is an example of a “sticky” tooltip map (the JavaScript functions have oviously changed slightly to make the tooltip stick). Finally, this technique also allows for us to place multiple maps on a single page, so we have lots of options.
Where in the world?#section8
Now back to those wonderful APIs. What if you want to use one place points on this world map by latitude and longitude?
Server side scripting examples of how to dynamically place points on the map are beyond the scope of this article, but here is some pseudo code to convert latitude and longitude points to pixels for the world map image used in our example:
/* For this example world map image in map coordinate
system GCS_WGS_1984 */

// set latitude and longitude
pointLat  = // between -90.00 and 90.00
pointLong = // between -180.00 and 180.00;

// get map height and width
mapHeight = // map height (in pixels)
mapWidth  = // map width (in pixels)

// convert latitude to pixels
pointLat = ( ( pointLat * -1 ) + 90 ) * ( mapHeight / 180 );

// convert longitude to pixels
pointLong = ( pointLong + 180 ) * ( mapWidth / 360 );

/* you may also have to correct for the size
of the point image placed on the map */
pointLat  = pointLat  - ( [point image height] / 2 );
pointLong = pointLong - ( [point image width] / 2);
If you are considering using server side scripting to dynamically place points on a map, you might also consider having the background image of the map be set by JavaScript. This would allow a dynamic page to assign different background map images to the dl based on the area or zoom level you would like to display.
A quick review#section9
Let’s review what we have done:
- Started with a text-based list that has geographic components
- Turned that text list into an HTML definition list
- Styled the
dlto look like a map - Styled the
dtelements into points located around the map using CSS - Styled the
ddelements to look like a tooltips, but moved them out of view - Used JavaScript to dynamically assign mouse and keyboard events to the map points
- Enabled the
dd“tooltips” to be styled back into view when the map points are hovered
What have we accomplished by doing this?
- Created a text-based map
- Enabled screen readers, text-based users, and search engines to “read” the map
- Created a pleasing visual map for sighted users
- Created an interactive map for mouse users
- Allowed non-mouse users to interact with the map with their keyboard
Where to go from here?#section10
The example of a more accessible map presented here is just that, a more accessible map. It does not claim to be the best way, just a different way to approach the problem of creating accessible geographic-type content without having to create multiple pages in different formats. This example will not address all types of accessibility needs, nor be an ideal solution to all types of web based maps or GIS applications; however, a text-based webpage is always a great starting point for addressing accessibility concerns.
Compared to other commonly used mapping methods, this technique starts with the data and builds a map around it. Text content is separated from the map layout. When content can be separated from layout the content is generally more accessible. This means that an alternative accessible version may not need to be created.
What we have built in this article is just the start of what might be done on a map. These same concepts could be used to place shapes, or even a drill down map to display detailed data for more specific areas or locations. The important thing to remember is to start with the text-based information you want to convey. First make the data readable and useful as text, and then make it into a map.
I’m all for accessibility, and this article is a nice example of how bloated applications can be made friendly towards those with impairments.
On another note, is it really safe to start using CSS(Cascading Style Sheets) 3 attributes?
I’m not seeing the need for JavaScript in this situation, if anything it makes the map less accessible (I know JavaScript and Accessibility are not mutually exclusive, but still).
There has been lots of examples of pure CSS image maps, which render mostly the same as the one shown here in addition to sharing similar markup. They also solve the CSS on/JavaScript off problem.
Be careful with the ‘this’ keyword in object literals, they are never instantiated (nor can they be) so ‘this’ isn’t exactly meaningful in an object oriented sort of way. Relying on it may lead to unexpected results.
Great example of the concept of always starting with the meaningful markup then style it and add it’s behaviour.
Nice one 😉
Another great article. I did not think it would be this easy to create custom map applications. This will be a good starting point for alot of developers.
Can anyone confirm the comment that “screen readers will ignore an HTML element with a style of display: none”
Can this really be true? And if so, why would a screen reader pay any attention to the purely presentation layer of CSS?
I’ve reread three times, peered at the examples, but I fail to see why javascript is needed for tooltips.
the CSS :hover pseudoclass would give you the same results, and for the sake of Internet Explorer there is this wonderful little javascript from Peter Nederlof: http://www.xs4all.nl/~peterned/csshover.html
I’m not sure if the map is always the added information to the tooltip text; in this example it maybe is as an indication of the place of a city added to the city information, but I guess there are many examples where the map itself plays a more central role. I think imagemaps would be better in that case. The technique is nice, the added benefits are clear, but only for appropriate needs.
David wrote:
bq. Can anyone confirm the comment that “screen readers will ignore an HTML element with a style of display: none”?
Yes, indeed. See Joe Clark’s “Facts and Opinion About Fahrner Image Replacement”:http://www.alistapart.com/articles/fir/ in the October 20, 2003 issue of this magazine.
bq. Can this really be true? And if so, why would a screen reader pay any attention to the purely presentation layer of CSS?
Because they don’t talk to standards-based designers?
Martijn wrote:
bq. I’ve reread three times, peered at the examples, but I fail to see why javascript is needed for tooltips.
At first I thought so too. I experimented with pure CSS options and, sure, you could use a selector like @dt:hover + dd@ to trigger the tooltip, but you lose the ability to add the “sticky” option. More importantly though, you lose the ability to turn the map “on” and “off.” I think turning the map “on” is a key feature and you could pretty easily enhance this script by creating a method to disable the map-based views _en masse_ or individually, which is a great usability enhancement.
bq. Yes, indeed. See Joe Clark’s Facts and Opinion About Fahrner Image Replacement in the October 20, 2003 issue of this magazine.
Wow – Great artical. Can’t belive I missed that one when crawling the ALA back catalog. However, surly the concusion that not reading _display: none;_ is wrong? afterall it is not _read: none;_ 🙂
To be realistic here, more people are going to use the Google/Yahoo map APIs than roll their own, so we also need a script to parse the DOM and place the locations and bubble content on a G/Y map. This of course won’t be as accessible as your pure CSS map, but it’s a lot better than pure Javascript map implementations.
I have been working on a site which displays healthcare technology grants and projects in the United States. I have argued with the business owner that unless someone needs to determine driving directions between points – or query data within a region – using a high resolution map, which can zoom past the state level just isn’t necessary.
For some – perhaps most map applications, too much data is in the presentation.
However, there is another side to this dirty edged sword. To manage the data points, one needs a common denominator to work with. Geocodes are the most efficient and there are tools (Yahoo has one) to input an address and get back a Geocode. Now the problem is that the resolution of the data is extremely rich – very precise GPS positioning, several decimal points of latitude/longitude. How does that scale into a 900px x 500px image?
The answer is not very well.
While working on a more dynamic, data driven site – here is a solution I came up with. It employs the all famous styleswitcher to give the viewer a choice between viewing the data points –
http://www.hitdashboard.com/unitedStates.aspx
Has anyone else had a problem with this in Firefox and Safari?
The tool tip loads fine for the first item but no others.
But it works find in IE.
if you have any sort of whitespace or tab between the opening
I prefer to say
so of course I’ve had a headache for the last 2 hours
If you view the full listing of the JavaScript:
http://www.alistapart.com/d/cssmaps/examples/js_full_listing.html
You will find a method that strips whitespace called “stripWhitespace”. The
stripWhitespace is used in the init method remove white space in the map dl:
mapMaker.stripWhitespace(mapMaker.DLs[i]);
Have you considered looking at the geo microformat? (http://microformats.org/wiki/geo)
I’d built a maps wrapper around it, described here: http://bluesmoon.blogspot.com/2006/01/of-microformats-and-geocoding.html
It’s one way of doing accessible maps.
Seth’s maps are interesting, imaginative and thought-provoking, but risk being ignored because they do not remotely satisfy the needs of visually unimpaired users of Google maps etc. One of the main uses of on-line maps is to ‘navigate’, not to discover the population and see a snapshot of the city that English speakers have always called (and continue to call) Bombay. And make no mistake, people do want to scroll and zoom, which is why the Ajax-powered rapidly-responding Google/ViaMichellin maps are so popular by comparison with the old world-wide-wait Multimaps.
I think there are two questions that should be asked:
1. Do visually-impaired people want to be able to obtain geographical navigational information of the sort provided by Google etc maps?
2. If so, can such accessible information be incorporated into the Google/ViaMichellin type of thing or is some other alternative more practical and appropriate?
I agree with what David has said above: that the consumers of Google/Yahoo maps are going to be more interested in navigating, scrolling, zooming etc, and less interested in pulling up little bits of data about the city.
At the same time, I think that once people begin proving out these sorts of concepts, and showing that maps can be made accessible whilst providing the levels of interactivity available in the popular API’s, then the excuse that accessibility had to be relegated to the back row to allow innovation becomes a moot point.
I think this article is an important first step, and would be interested in seeing some follows ups that start pushing it to the levels of flexibility that comes from the major API’s.
In the third example: http://www.alistapart.com/d/cssmaps/on-example/index.html
If I click one of those cities, and then return from Wikipedia to that map, there is no way to switch off the tooltip about the city, short of refreshing the page.
It compounds as more cities are clicked and the back button used. This wasin Firefox 1.5/Windows.
There is no denying it: text-based content can, if structured properly, be equally accessible to both the 20/20-vision general public, and to the visually impaired; but maps and other purely visual data cannot. I find the example in this article rather unrealistic (in agreement with comment 16 above): why would a visually impaired person go to a map site, to find out the population of Tokyo? Because that’s about the limit of what they can access in this example, and if they wanted to know that, they’d just go straight to Wikipedia.
This article brings to light the possibilities of truly accessible maps, but I don’t think that the example in the article is such a map. A truly accessible map would provide the meaningful and contextual geographic information (the essence of the map) to all users: e.g. the latitude and longitude of each city, the distance and direction of the 10 nearest cities, nearby seas and mountains, etc. The real question is: if enough of the right text-based content is put into a map, can it be a real substitute for the full visual experience? The only way to know would be to attempt building such a map.
_PS:_ all this is reminding me of MUDs (Multi User Dungeons – text-based multiplayer games), which are able to convey contextual geographic information through a text console. E.g.: “to your north is a city, to your south lies the ocean”, etc. Perhaps web-based maps could learn something from this?
There’s no denying that this is more accessible than most, and I think that’s a brilliant place for us all to start. I’m not convinced this method would carry over well to large applications, but for small sites I’ll certainly be using Seth’s technique in the future – thanks!
On a side note:
bq. PS: all this is reminding me of MUDs … which are able to convey contextual geographic information through a text console. E.g.: “to your north is a city, to your south lies the ocean”?
This makes me feel warm and fuzzy inside. Let’s get started!
At my “:hover emulation for IE5+”:http://users.hszk.bme.hu/~hj130/css/list_menu/hover/index.html
solution, I used the same idea in my “hot spot example”:http://users.hszk.bme.hu/~hj130/css/list_menu/hover/example_hotspot/index.html
.
This way the tooltips are “half sticky”. You can mouseover the tooltip but it hides when you mouseout. I think in many situation this is easier for the user as clicking a close button to hide the tooltip.
I did something similar to this a couple weeks ago (http://infinity-stuff.com/blog/20060313/interactive-images/), obviously not as nice as this but the same kind of idea.
Its nice to see accessibility and neat effects combined together to make something great.
Nice stuff .. sounds familiar.
Reminds me of “an article”:http://www.data-travelers.de/2006/03/21/imagelist.html I wrote about a month ago – and my “old website”:http://www.f2w.de/article.php showing off that knowledge for more than half a year, too. 😉
Note: Currently the domain name (data-travelers.de) is moving to another IP address, thus the link’ll be valid again in a few hours.
cu, w0lf.
I found while tabbing through the sticky example that the map would only show for every third press of the tab key. It seemed the first time it is pressed the sticky is shown and points to the Wikipedia link. The second the sticky is not shown and the link points to “javascript:void(0);” (presumably the close sticky button). The third press presents is to the same link as the first example, but no sticky (presumably to the Wikipedia link within the sticky). Can the modified code for the sticky version be updated to avoid following these links?
A simple (although not very elegant) way around the tabbing in the sticky map example would be to add tabindex attributes to all the anchor tags within the DTs.
If the HTML comment at the top of the source in the “stickymap example”:http://www.alistapart.com/d/cssmaps/stickymap/index.html is removed and the page is loaded in IE7b2, the tooltip layout breaks. The close button (a cross image) moves outside the tooltip, and if there is no image within the tooltip, text flows outside it on the right-hand side.
Odd.
The HTML comment at the top of the source causes IE6 (as well as IE7b2) to switch to quirks mode. This must be part of the problem. To test if IE is in standards-compliance or quirks mode, type
javascript:alert(document.compatMode);
into the address bar after loading a page. ‘BackCompat’ means quirks, ‘CSS1Compat’ means standards.
Good article, I will be experimenting with this. Good to see with API’s, accesibility is still an option.
for sure good article, nice map, more accessible than others but
sorry but there is still a big problem. When i turn off the image but not the css, the map and the spot desappear
What could make this kind of a map even better, would be the ability to search within the grids. I was working on a similar thing a few years back. But as the client was less interested we gave it up.
Imagine me just searching for a street in a map and the particular streets gets highlighted.
After google earth, there are very few things i now desire in a map. Cheers!
It seems to me that online maps fall into two categories: cases where the map is used to organise and present some information, and cases where the map IS the information.
For the former case, the technique presented in this article could no doubt be very useful. For the latter case – which will cover a lot of Google/Yahoo maps usage – it’s a lot less applicable: There’s a huge amount of visual information in the map, to which we might add a few identified points.
For example, if I were using Google Maps to display the position of a particular building, it’s pointless trying to describe all the visual information that Google makes available. Just leave it alone, but add a text description of how to get to the place – if you were visually impaired and wanted to go there, where should you tell a taxi driver to take you? What bus/train would you catch? (This infirmation may be useful to sighted visitors too!)
In the Init method, shouldn’t the line
var DTs = DLs[i].getElementsById( ‘dt’ );
be
var DTs = DLs[i].getElementsByTagName( ‘dt’ );
?
Yes that does appear to be a typo in the article. View the full source of the javascript to see the entire init method.
Can someone create a “mapMaker.reinit()” function which will fix the tooltips after the city list has been dynamically changed? 😉
The code below should do what you need:
reinit: function(){
mapMaker.on = false;
var i=0;
mapMaker.DLs = document.getElementsByTagName(‘dl’);
while (mapMaker.DLs.length > i) {
if (mapMaker.DLs[i].className == ‘map on’){
mapMaker.DLs[i].className = ‘map’;
i++;
};
};
mapMaker.init();
},
Worth pointing out that (at least in IE<7) element.class1.class2.[...].classN is reduced down to element.classN
This means that your dl.map.on rule would apply to all
elements on the page (although you can appreciate the relative chances of this aren’t high)
In the Init method, shouldn’t the line
var DTs = DLs[i].getElementsById( “˜dt’ );
be
var DTs = DLs[i].getElementsByTagName( “˜dt’ );
?
is it should
http://www.replicahours.com
Great article Seth. I thought you(and others!) might like to see what we did with our maps, http://www.travbuddy.com/world_display.php
*@”Ismael”:http://www.alistapart.com/comments/cssmaps?page=4#32 and “Bob”:http://www.alistapart.com/comments/cssmaps?page=4#37:* thanks for catching that. We’ve made the change.
Perfect.
Title? (Function to show/hide all tooltips?)
Good article, I will be experimenting with this in my nexts projects.
Thanks for this great idea!
Greets Maik
Thank you very much for this article. I’m just trying to integrate a map on my site and your article is really helpful in this case.
You will certainly recognise me as a novice 😉 but I’m trying. Also, I know my question would be better posted to some JavaScript page. But would you so kind and explain me the meaning of the double dollar sign ‘$$’ as in
this.$$handleEvent(event) === false or
handlers[handler.$$guid] = handler;
I hope I’m not troubling you too much (as novices always do).
Igor
In Safari I’ve noticed that my CSS is loading after the tooltip images… Firefox and IE are fine… any suggestions? Should I move the CSS for the map inline?
http://fearlessfilms.net/ffnew/locations.html
Thanks!
Great bit of programming!
When I use the examples here, they work great.
When I copy it to my own PC and run it, the IE popup blocker interferes. Any way to fix this?
Never mind. When I publish the map, it works fine.
You can try it at
http://www.api-usa.com/api_rep_map.htm
Thanks!
Great article, thank you. Shortly after reading it, a project came up that seemed perfect for a non-API environment. We’re trying this method for a quiz, where the map & tool tips hold the answers. http://salmonnation.com/place/where_bioregion_quiz.html
The backgroudn map is a dummy of course, which I’m using to help me place the x,y of the location points. I’ll just upload a new background image when done.
After looking at the code for a few hours, I can’t figure out why all the points seem to be off by approx x6,y-12 pixels. Your ideas? Also, something is busted in PC IE, where the map doesn’t display at all.
external files are http://salmonnation.com/includes/map.css and http://salmonnation.com/includes/mapevents.js
First of all, thank you for creating this script. I have been successful in implementing the map, but would like to substitute an onmouseout timer for the close button. I abandoned the close image because my dd content will vary in width, and using dd width:auto; with the img float:right; makes the entire dd stretch across the screen.
My goal is to have an interactive pop-up that will disappear once I stop interacting with it. I have added an onmouseout event to the dd, but it only recognizes the first line in the dd. I know this is a long-shot, but do you have any suggestions?
Thank you in advance for any help you can offer.
Paul
Got this working in most browswers, except for Safari is still rendering as though without CSS. Any ideas? http://salmonnation.com/place/where_bioregion_quiz.html